
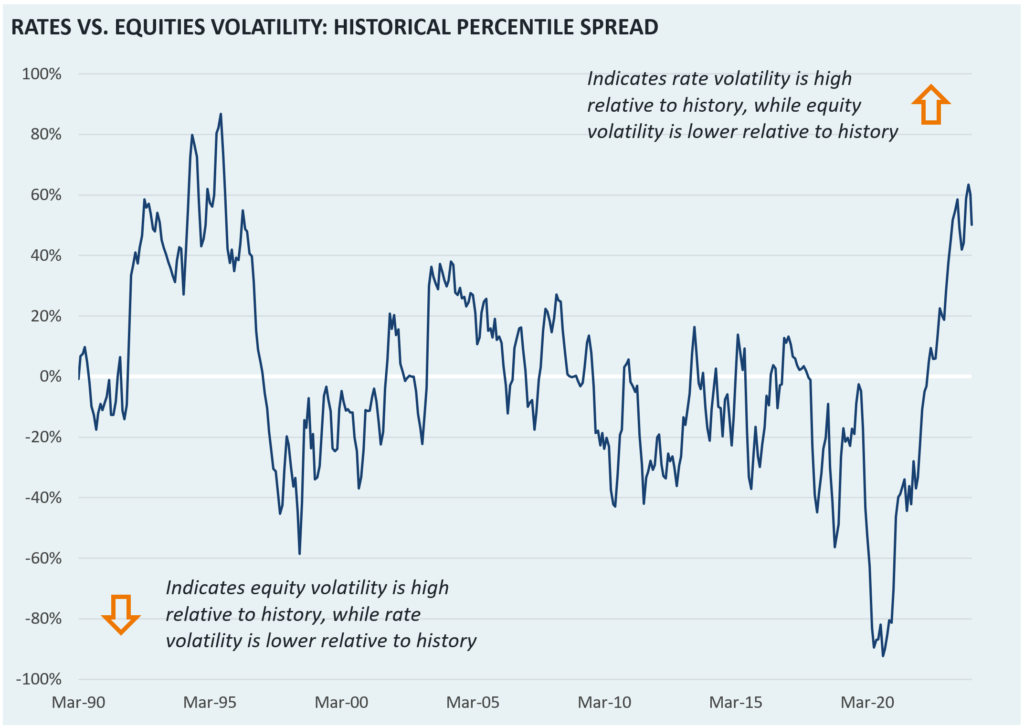
Trends in implied volatility have shown large differences between rates and equity markets. Implied rate volatility, measured by the ICE BofA MOVE index, has been high as an unclear economic outlook has translated to a constantly shifting Fed path. In contrast, equity implied volatility (measured by the CBOE VIX index) has been low as equities have rallied off resilient earnings and strong growth from mega-cap technology.
Our chart of the week looks at the relationship between rate and equity volatility by comparing historical percentiles dating back to 1990. By taking a spread between the rate and equity percentile, we get a clear picture of environments when implied volatility is materially higher for one asset class versus the other. Solidifying the uniqueness of the current period, our chart shows that we have not seen a relationship like this since 1995 (which is also viewed as the Fed’s only “soft landing”).
The Verus Market Note provides market commentary along with relevant charts and graphs. Each week, we highlight a key story from the finance world that we believe will pique your interest. While these insights are meant to inform and enrich your understanding of the current market landscape, they should not be taken as direct recommendations for immediate portfolio adjustments.