Executive summary
Downside risk is the undesirable and often unforeseen risk of a market drawdown which negatively affects portfolio performance. This risk is usually associated with equities, for which investors expect to receive compensation in the form of higher returns over the long run. Drawdowns can occur for many reasons, and in this paper we will outline the most common causes: sector-specific impacts on the broader market, volatility as market momentum reverses, and shifts in macroeconomic conditions. Next, we will describe how the negative correlation of traditional fixed income to equities may act to mitigate equity drawdown risk. Finally, we will explain how these characteristics relate to the more active role that fixed income may play in broader portfolio risk management.
Market drawdown environments
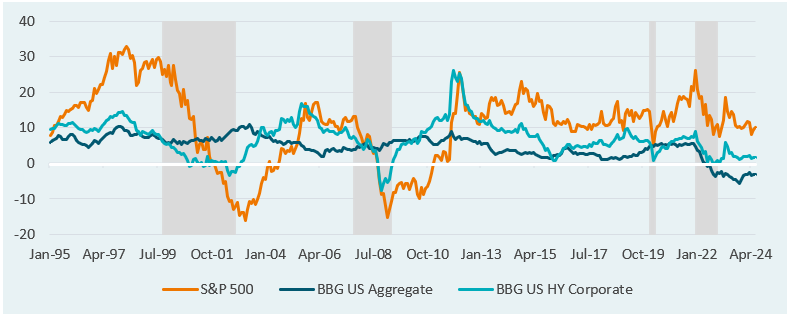
Drawdowns in equity markets have a variety of causes. Unexpected negative events within a particular sector or geography can lead to knock-on effects in the broader economy and markets. A notable example occurred in 2008, when rising defaults and foreclosures in the housing market sparked cascading losses in the mortgage-backed security market, and a subsequent selloff in equities. Equity markets during this period, represented by the S&P 500 index, saw losses of roughly -28.0%.1 Similarly, lower quality corporate credit, represented by the Bloomberg US High Yield Corporate index, experienced a negative return of -8.6%, while core fixed income, measured by the Bloomberg US Aggregate index, returned +5.5%.
The normal volatility of markets also contributes to market corrections, often defined as equity market drawdowns of more than 10%. These occur fairly frequently, with 13 corrections in the last two decades.2 During the first two months of 2018, the S&P 500 index lost over -10%, followed by a brief rally before the index fell another -19% between September and December of that year. During the selloff in the latter half of the year, traditional core fixed income experienced positive returns of approximately +1%. Lower quality corporate bonds performed directionally in line with equities, though losses were limited to -4%.3
Shifts in macroeconomic conditions may also fuel market drawdowns. From a historical perspective, bond markets (and the overall U.S. economy) benefited from a period of falling interest rates from the 1980s to 2020, when rates eventually reached nearly 0% following the onset of the Coronavirus pandemic. In an effort to normalize interest rates and fight inflation, the Federal Reserve Bank began increasing interest rates rapidly.4 We discussed this dynamic and the impact on portfolio diversification in detail in our previous piece, ‘Is Painless Diversification Back?’.5 Rapid shifts in monetary policy, particularly rate increases, are often a prelude to slowing economic growth and a subsequent market drawdown. In 2022, this shift in monetary policy led to the U.S. Treasury yield curve inversion, and equities saw losses of over -17% during the first three quarters.6 The negative performance of both traditional fixed income and credit was severe during this time, losing -15% and -12%, respectively over this period.7 This negative performance experienced by both traditional fixed income and credit was extremely unusual. This was largely due to the duration profile of the indexes and magnitude of interest rate hikes, but most importantly the fact that yields at the beginning of the episode were so low. In such a low yield environment, losses from interest rate moves can quickly bring a fixed income portfolio to negative overall performance due to a lack of yield cushion. Both traditional fixed income and credit incurred fewer losses than equities over the period.
Equity vs. Fixed income performance

Source: eVestment and Bloomberg
Portfolio correlation
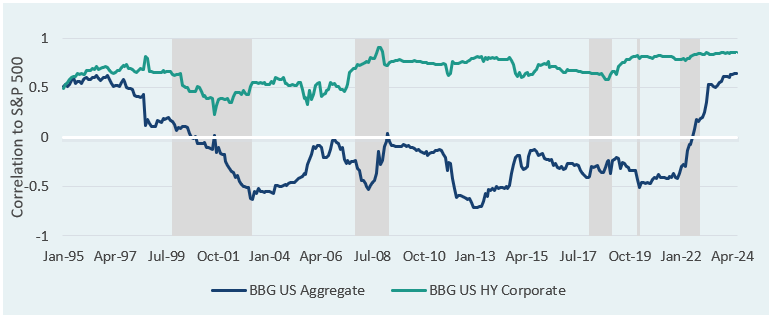
The relationship between bonds and equities, measured by their correlation, can vary significantly through time.
The often negative correlation between equity and fixed income has historically protected diversified portfolios from drawdown risk, with these assets moving in different directions during market turmoil, resulting in a smoother overall return profile over time. This correlation gradually became less negative in the years leading up to the 2008 market crash, peaking at near zero in November 2006. As market volatility increased, the Federal Reserve began rapidly cutting interest rates to stimulate economic growth. Investors reacted by reallocating from equities and into traditional fixed income, contributing to correlations dropping sharply to -50%.8 As rates were brought to near-zero levels in 2008, demand for lower yielding fixed income decreased, contributing to rising correlations as equity markets continued to fall. In 2008, when equities experienced their sharpest drawdown, fixed income assets saw the highest level of negative correlation, providing portfolios with a source of positive return and a smoother return outcome.
Following the pandemic in 2022, the Fed embarked on interest rate hikes to combat high inflation. Equity markets subsequently suffered the most significant drawdown since 2008. Unlike previous periods, however, fixed income assets also experienced sharp negative performance as interest rates jumped. After the shift in rates in 2022, traditional fixed income correlations with equities rose from -40% to 60%. Notably, relative to credit’s consistent correlation to equities of 75-85%, traditional fixed income correlation during this period was relatively muted. Historically, market sentiment tends to create selling pressure on credit during drawdowns. This trend typically creates demand for high quality fixed income which dampens negative returns during drawdowns. As a result, this broader correlation provides further evidence that exposures to traditional fixed income can benefit portfolios during periods of increased volatility.
Fixed income correlation to Equity

Source: eVestment and Bloomberg
Fixed income & active risk management
While fixed income is traditionally seen as a diversifier in terms of returns and correlations, we believe that many top-down and bottom-up portfolio construction approaches can also play a role in avoiding downside risks. Top-down approaches include interest rate exposure management, as drawdown periods often coincide with shifts in the yield curve. Active fixed income managers seek to balance interest rate exposure through active portfolio duration management. In periods of low or falling interest rates, duration can be extended, while the inverse can be done in periods of rising rates. Another top-down approach, assessing inflation risk, can be mitigated by active managers allocating to inflation-sensitive assets as a part of a fixed income mandate to mitigate rising inflation.
Bottom-up approaches such as liquidity management can also be prioritized, as drawdowns often lead to rising cash needs, which can cause forced sales of assets at impaired pricing. This is potentially mitigated by tiering liquidity within the portfolio across both maturities and quality in the event assets must be sold. Traditional fixed income, being composed of lower-risk, liquid, U.S. government bonds and investment-grade credit, is highly liquid. This, combined with the tendency of the asset class to outperform when other assets lag, often leads to traditional fixed income being sold when a portfolio has a sudden increase in cash demand.
Investors might also seek to mitigate both systematic and non-systematic risks during drawdowns. For systematic risks, traditional fixed income mandates tend to be complemented with higher yielding, riskier corporate credit, and securitized assets. Active portfolio managers often vary the weights of these sectors over time given their economic outlook and relative valuations. This typically translates to a majority of strategies overweighting lower risk sectors when the market is not compensating for risk. This often results in traditional fixed income mandates outperforming credit and equity mandates in these drawdown periods. More flexible mandates in risk-on environments will overweight lower quality credits and securitized strategies to outyield higher quality fixed income. This can be additive to portfolio returns, but also introduces the risk of holding equity-like volatility during drawdowns. Nonsystematic risks, or idiosyncratic risks of bonds, are another focus of research by managers in both fixed income and equity. This is conducted through a deep analysis of issuers to determine their resilience in periods of stress and involves avoiding names that would be the most sensitive to a downturn.
Conclusion
Risk assets such as equities present ongoing downside risk, which negatively affects portfolio performance in times of turmoil. In this paper we outlined the various reasons for market drawdowns, such as sector-specific impacts on the broader market, the ongoing volatility of markets, and shifts in macroeconomic conditions. Then, we discussed how the negative correlation of traditional fixed income with equities has historically helped to mitigate drawdown risk. Lastly, we explained how these characteristics relate to the more active role that fixed income may play in broader portfolio risk management. For more information about our fixed income views, please contact your Verus consultants.
Notes & Disclosures
- Analytics. eVestment. (2024). https://app.evestment.com/Analytics/#!Q29tcGFyZQ. ↩︎
- Schwab.com. (2022, February 22). Market corrections are more common than you think. Schwab Brokerage. https://www.schwab.com/learn/story/market-corrections-are-more-common-than-you-think ↩︎
- Barclays Live. (2024). Barclays Live – Bloomberg Index Return. BarCap Live. https://live.barcap.com/BC/barcaplive?menuCode=I_BB_BI ↩︎
- Garrett, T. (2023, January 19). Is painless diversification back?. Verus. https://www.verusinvestments.com/is-painless-diversification-back/ ↩︎
- Meeting calendars and information. The Fed – Meeting calendars and information. (2022, April 6). https://www.federalreserve.gov/monetarypolicy/fomccalendars.htm ↩︎
- Barclays Live. (2024). Barclays Live – Bloomberg Index Return. BarCap Live. https://live.barcap.com/BC/barcaplive?menuCode=I_BB_BI ↩︎
- Barclays Live. (2024). Barclays Live – Bloomberg Index Return. BarCap Live. https://live.barcap.com/BC/barcaplive?menuCode=I_BB_BI ↩︎
- Analytics. eVestment. (2024). https://app.evestment.com/Analytics/#!Q29tcGFyZQ.
Bloomberg L.P. (2024). SPX [Price & history graph]. Retrieved from Bloomberg database ↩︎
Past performance is no guarantee of future results. This report or presentation is provided for informational purposes only and is directed to institutional clients and eligible institutional counterparties only and should not be relied upon by retail investors. Nothing herein constitutes investment, legal, accounting or tax advice, or a recommendation to buy, sell or hold a security or pursue a particular investment vehicle or any trading strategy. The opinions and information expressed are current as of the date provided or cited only and are subject to change without notice. This information is obtained from sources deemed reliable, but there is no representation or warranty as to its accuracy, completeness or reliability. This report or presentation cannot be used by the recipient for advertising or sales promotion purposes.
The material may include estimates, outlooks, projections and other “forward-looking statements.” Such statements can be identified by the use of terminology such as “believes,” “expects,” “may,” “will,” “should,” “anticipates,” or the negative of any of the foregoing or comparable terminology, or by discussion of strategy, or assumptions such as economic conditions underlying other statements. No assurance can be given that future results described or implied by any forward looking information will be achieved. Actual events may differ significantly from those presented. Investing entails risks, including possible loss of principal. Risk controls and models do not promise any level of performance or guarantee against loss of principal.


