
Executive summary
The rise and fall of interest rates can have a significant positive or negative impact on fixed income portfolio performance. The pathway of interest rates is influenced by multiple factors including the market’s expectation of future economic growth, the Federal Reserve’s monetary policies (as well as expectations for how those policies might evolve), and exogenous shocks. To position portfolios to maximize return while minimizing risk, investors should consider a range of scenarios that can help mitigate the impacts of changes in interest rates while potentially benefiting from them over a full market cycle.
Interest rate regimes
Historically, changes in monetary policy by the Federal Reserve Bank (the Fed) tend to be correlated to the pace of economic growth. We might categorize interest rate environments into three regimes: rising, falling, and stable. Rising interest rate environments are usually associated with conditions such as improving economic activity, strong employment, and rising inflation. During these periods, the Fed often begins raising interest rates to control the pace of growth and inflation. Conversely, when economic growth slows and unemployment rises, the Fed often lowers interest rates to stimulate economic activity. During both types of environments, interest rate volatility can increase, which generates fixed income performance volatility. A stable interest rate environment tends to coincide with moderate economic growth, stable unemployment, and low volatility. During this regime, fixed income portfolios can offer predictable cash flows and returns.
We have arguably experienced a full interest rate cycle before, and including, the pandemic response beginning in 2020. However, because of the exogenous nature of that event, a more relevant example would likely be the period leading up to, and including, the Great Financial Crisis, beginning in 2003. Following the Dot.com recession in late 2001, the Fed lowered interest rates to roughly 1.75% and maintained that level until 2004.1 During this period, inflation remained subdued as the economy recovered.2 Broadly, fixed income returns as measured by the Bloomberg US Aggregate Bond Index (the Aggregate Index) were positive, albeit below the recent trend.
Beginning in mid-2004, the Fed began raising rates based on concerns over rising asset prices, specifically housing, and increasing inflation.3 Between June 2004, and June 2006, the Fed increased interest rates 17 times, each by 0.25%, in an effort to cool the economy and deflate the growing housing bubble.4 During this period, fixed income returns were solid with the Aggregate Index averaging 3.7% annually.5 Beginning in 2007, signs of stress in the economy became evident as the housing market weakened considerably, which preceded the significant increase in unemployment. To arrest the decline, the Fed began lowering interest rates in late 2007, completing their policy adjustment with the last rate cut in December 2008. During this period, the Federal Funds rate fell from 5.25% to roughly 0.25%.6 Given the economic unrest, it is not a surprise that higher-quality fixed income significantly outperformed lower-quality bonds during this time. In 2008, the Aggregate index returned 5.2% compared to -23.2% for the Bloomberg US High Yield Bond Index.7
While our example may be extreme, it does depict the relationship between economic growth and the pathway of interest rates. Generally, the Fed will use the Federal Funds rate as a shock absorber for the economy, trying to raise and lower rates to control the pace of economic growth. While the volatility of short-term rates is largely dependent on the market’s expectations for monetary policy, longer-term interest rates are influenced by other factors such as inflation expectations, investors’ risk appetite, and the health of the economy which is reflected in credit spreads. Performance of fixed income sectors, while usually strongly correlated, can differ significantly during both the phase shifts of interest rates and general economic health.
The shape of the yield curve
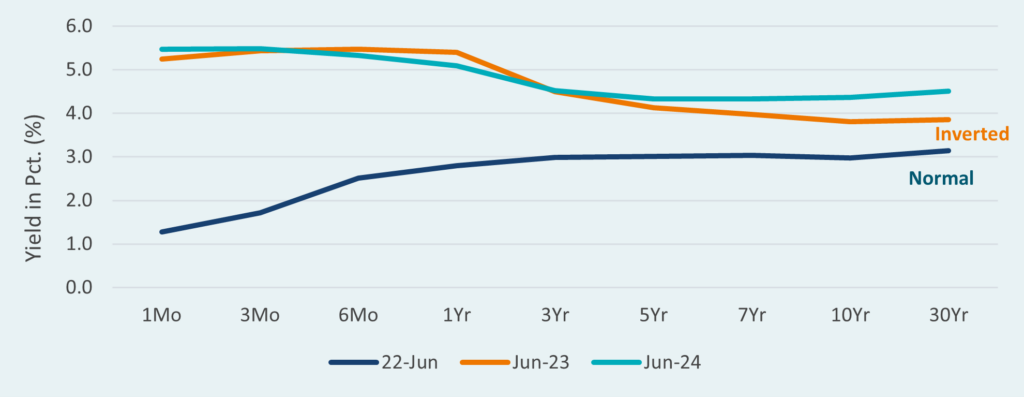
The shape of the yield curve measures the difference between short-term and long-term bond rates. Historically, the shape of the yield curve has been used as an indicator of both future economic activity and investors’ future interest rate expectations. During periods of economic expansion, the yield curve tends to be normally shaped with shorter-term rates below longer-term rates. In this instance, investors demand higher compensation for holding long-term maturities due to concerns related to inflation risk and the opportunity cost of holding long-term fixed income. Conversely, during periods when future economic growth is in question, short-term interest rates might exceed long-term rates, also known as an inverted yield curve. Here, investors expect increased stress in the economy and lower future rates and often prefer to move further out the curve and hold long-term, high-quality bonds as protection.
Recently, despite continued economic growth, the U.S. Treasury yield curve has marked the longest period of curve inversion in history at more than two years.8 While in the past this sort of anomaly would have been a strong harbinger of economic slowing and a potential recession, economic growth has remained stubbornly above trend. However, there are ramifications for a persistently inverted yield curve. Most importantly, banks find the environment particularly challenging given that they tend to borrow over short horizons and lend over long-term horizons. As a result, banks’ profitability suffers which often leads to the slowing of new loan creation. Seeing as how many businesses require loans to fund operations, the limited access to credit can blunt economic activity.
U.S. Treasury yield curve
Return patterns under different economic and interest rate scenarios
Unlike interest rates and economic activity which tend to be positively correlated, interest rates and the return patterns for most bonds have an inverse relationship. Increasing economic activity usually results in higher inflation expectations. Because the Federal Reserve’s mandate is to ensure price stability, it embarks on a period of raising interest rates to quell demand and slow growth. Longer duration bonds usually suffer during these periods regardless of credit quality. However, lower-quality bonds tend to perform better given their sensitivity to the economy and shorter duration profile. As seen below, high yield bond returns have historically delivered positive returns leading up to, and including, the rising rate periods. Conversely, the longer duration Bloomberg U.S. Treasury 7-10 Year index typically underperforms. The primary drivers for this divergence in return patterns include: the higher coupon of corporate bonds (higher coupon means less interest rate sensitivity), shorter duration (shorter tenor bonds mean less interest rate sensitivity), and the improvement in the borrower’s capacity to pay principal and interest (a compression in bond yield which boosts current value).
Bond returns vs. Fed funds
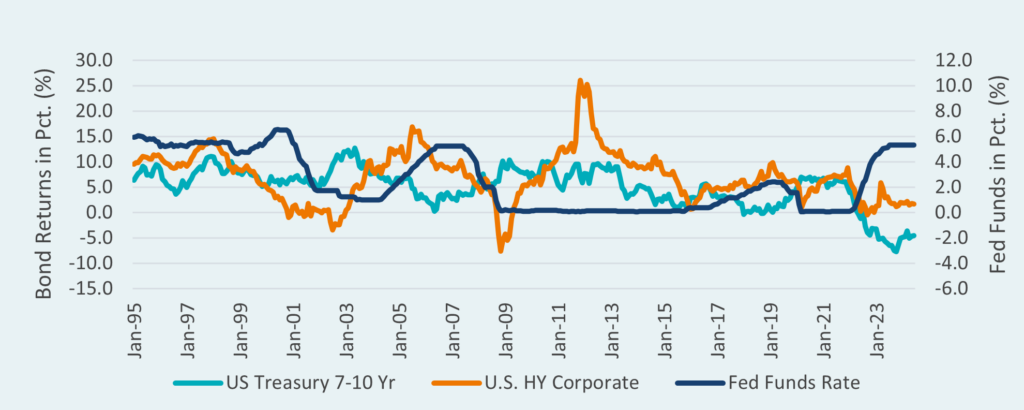
After interest rates peak, there tends to be a period of stable returns before the beginning of the next leg of the interest rate cycle. During this period, economic activity is often decelerating which leads to greater investor concerns about the ability of borrowers to pay. To avoid default and drawdown risks, many investors will rotate into higher-quality bonds and away from lower-quality bonds. As seen below, the bottom in the interest rate cutting cycle often marks the low in lower quality bonds and the peak in higher quality bond returns. As the economy stabilizes and growth returns, lower-quality bonds begin to recover and the investor appetite for risk increases. Eventually, the cycle repeats and the Fed will begin the process of raising interest rates as growth accelerates.
Conclusion
The performance of fixed income portfolios across sectors is impacted differently by changes in interest rates and other factors. The cyclicality of interest rates and the economy is strongly correlated, and this can be seen in observable historical patterns. We believe that by understanding the relationship between different scenarios and patterns, investors can position their portfolios to benefit both from improved returns and mitigating risks. For more information about our interest rate views, please reach out to your Verus consultants.
Notes & Disclosures
- U.S. Federal Reserve Bank, Open Market Operations, https://www.federalreserve.gov/monetarypolicy/openmarket.htm ↩︎
- Federal Reserve Bank of St. Louis, Consumer Price Index for All Urban Consumers, https://fred.stlouisfed.org/series/CPIAUCSL#0 ↩︎
- Federal Reserve Bank of St. Louis, Median Sales Price of Houses Sold for the US, https://fred.stlouisfed.org/series/MSPUS and Federal Reserve Bank of St. Louis, Consumer Price Index for All Urban Consumers, https://fred.stlouisfed.org/series/CPIAUCSL#0 ↩︎
- U.S. Federal Reserve Bank, Open Market Operations, https://www.federalreserve.gov/monetarypolicy/openmarket.htm ↩︎
- Bloomberg U.S. Aggregate Bond Index, https://www.evestment.com ↩︎
- U.S. Federal Reserve Bank, Open Market Operations, https://www.federalreserve.gov/monetarypolicy/openmarket.htm ↩︎
- Bloomberg U.S. Corporate High Yield Bond Index, https://www.evestment.com ↩︎
- U.S. Bank Wealth Management, Treasury Yields Remain Inverted as Investors Continue to Weigh Risk of Recession, https://www.usbank.com/investing/financial-perspectives/market-news/treasury-yields-invert-as-investors-weigh-risk-of-recession.html ↩︎
Past performance is no guarantee of future results. This report or presentation is provided for informational purposes only and is directed to institutional clients and eligible institutional counterparties only and should not be relied upon by retail investors. Nothing herein constitutes investment, legal, accounting or tax advice, or a recommendation to buy, sell or hold a security or pursue a particular investment vehicle or any trading strategy. The opinions and information expressed are current as of the date provided or cited only and are subject to change without notice. This information is obtained from sources deemed reliable, but there is no representation or warranty as to its accuracy, completeness or reliability. This report or presentation cannot be used by the recipient for advertising or sales promotion purposes.
The material may include estimates, outlooks, projections and other “forward-looking statements.” Such statements can be identified by the use of terminology such as “believes,” “expects,” “may,” “will,” “should,” “anticipates,” or the negative of any of the foregoing or comparable terminology, or by discussion of strategy, or assumptions such as economic conditions underlying other statements. No assurance can be given that future results described or implied by any forward looking information will be achieved. Actual events may differ significantly from those presented. Investing entails risks, including possible loss of principal. Risk controls and models do not promise any level of performance or guarantee against loss of principal.