
Introduction
The purpose of a pension plan’s investment portfolio (assets) is to ensure that promised benefits (liabilities) can be paid to beneficiaries as they come due. However, many plan sponsors approach their investment policy without explicitly focusing on the liabilities that the assets support. Liability Driven Investing (LDI) is an alternative approach that we believe can offer considerable value to many public institutions.
Executive Summary
Liability Driven Investing (LDI) is an investment strategy that matches a pension plan’s future benefit payments with cashflows generated by a fixed income portfolio1. While LDI approaches are popular among corporate plan sponsors, they are less prevalent with public plans. In this Topic of Interest white paper, we explore this dichotomy in adoption between sponsor types to gain an understanding of how public sponsors can better implement LDI solutions. Next, we discuss the characteristics of pension plans that make LDI strategies beneficial. Lastly, we assess the current environment, to illustrate why LDI may appear relatively attractive today.
How is a pension plan’s financial health measured?
Pension plan sponsors measure their financial health with funded status, calculated as the plan’s assets divided by its liabilities. The plan’s actuary calculates liabilities by discounting all future expected benefit payments to participants to arrive at a present value. The discount rate used for determining the liability is the largest driver of differing levels of LDI adoption among sponsor types2. The two key types of discount rates are summarized below:
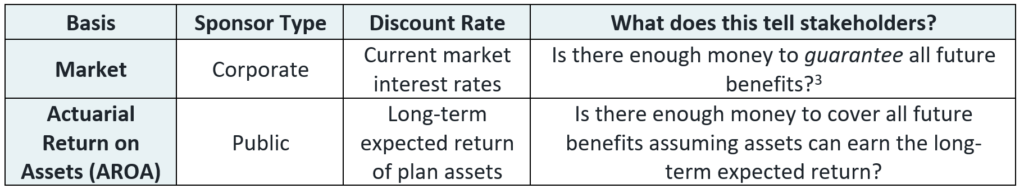
Corporate sponsors are held to market-based requirements when reporting liabilities. On this basis, liabilities are discounted at prevailing interest rates, which can lead to volatile measurements of liabilities when interest rate conditions change. Therefore, corporations tend to be concerned with managing short-term interest rate risk. LDI has proven effective for managing this risk, as it causes the asset portfolio to move in tandem with liabilities as interest rates change, resulting in less funded status volatility.
Public sponsors on the other hand, discount liabilities with the AROA, a long-term expectation for asset returns, which tends to be relatively stable over time. Therefore, liabilities are less volatile and not directly tied to the interest rate environment. As a result, LDI does not typically reduce volatility in the plan’s reported financial health (funded status), and the perceived benefit of LDI is not as obvious4.
How can public plans implement LDI?
LDI offers inherent economic benefits for most pension investors. Therefore, we find it unfortunate that reporting requirements are such a large driver of its adoption. With that said, we acknowledge that adopting corporate-style LDI solutions may simply be untenable for sponsors subjected to AROA-based reporting requirements. Matching a pension plan’s cashflow profile generally results in an LDI portfolio with a duration of 10 – 20 years, which can lead to significant short-term volatility. For non-corporate sponsors, this means that traditional LDI solutions may not mitigate funded status and contribution volatility effectively. However, the following LDI implementations may help to overcome these challenges:
- Short-term LDI: Match only the first 3-7 years of cashflows
- Long-term LDI: Match longer-duration cashflows (e.g., all current retirees) combined with market-based reporting for that portion of the liability
The simplest way for non-corporate sponsors to achieve some benefits of LDI is to match only the first few years of outflows using a short-term LDI strategy, allowing the LDI portfolio to maintain a short duration. This strategy can provide short to intermediate term liquidity with better rates of return and lower risk than cash, without leading to excessive funded status and contribution volatility under traditional AROA-based measurements.
To achieve the greater economic risk reduction benefits of a traditional long-term LDI strategy, public sponsors should implement it alongside a market-based measurement of the liability – a concept often referred to as “dedication”. By adopting a market-based valuation for the portion of the liability backed by the LDI portfolio, the assets and liabilities move in tandem. This approach effectively carves out a de-risked portion of the plan that should remain 100% funded over time. The remaining plan continues to operate like a traditional public plan, but with lower overall risk levels because of the reduced balance sheet size5.
Benefits of liability driven investing
Improved risk/reward tradeoffs
Under a traditional asset-only approach to investing, cash is seen as the asset class with the lowest volatility. However, given a pension plan’s lengthy time horizon, cash has a tremendous amount of reinvestment risk. An investor does not know how the interest rate environment will change and therefore does not know how much money would need to be set aside in cash to meet a specified future payment.
Consequently, the lowest risk asset class for pension investors are fixed income securities, with which the income is immediately used to pay benefit payments (i.e., a cashflow matching security). The security is held to maturity, so there is no interest rate risk. It also does not have any reinvestment risk, as income is used in full to pay benefit payments upon receipt. We know the rate of return on the security (yield to maturity) and exactly how much future benefit payment the security will cover, even if we don’t know the exact sequence of returns that gets us there. This is noteworthy; by moving from cash to cashflow matching fixed income, pension investors take advantage of the uniqueness of their liability profile and the upward sloping nature of yield curves to improve expected returns while reducing risk.
Reducing drawdown risk
As pension plans mature, the number of retirees increase relative to the active population, and benefit payments rise relative to contributions. The resulting negative cashflow profile has a notable impact on a plan’s drawdown exposure. During periods of market stress, mature plans may be forced to sell assets at depressed prices to meet liability payments. LDI can help a plan overcome these challenges by providing the needed cash to cover obligations that come due in the short-term, allowing the return-seeking portfolio to grow unencumbered for the long term over which returns are far more predictable6.
Limiting downside exposure for mature plans
For plans that have been accruing benefits for decades, liabilities can be large relative to the organizations that support them. This might place an increasing burden on the current generation of employees, employers, taxpayers, and other stakeholders who financially support the plan when the investment experience fails to meet expectations. LDI can be an effective way to manage this downside risk. By guaranteeing portions of the plan with a dedicated LDI portfolio, stakeholders face more manageable levels of potential cost increases.
Managing asymmetric tradeoffs
As public sponsors approach full funding, the benefits of risk taking are often reduced, and plans become economically incentivized to reduce risk. This occurs because a common consequence of a plan holding surplus assets, is some action that disproportionately favors one group of stakeholders while increasing the overall risk of the system. As an example, this often comes in the form of increased benefit levels. LDI presents an alternative that benefits all stakeholders; using surplus assets to guarantee portions of the plan through a dedication strategy and decreasing the risk of the pension system moving forward7.
Opportunities for public plans to pursue LDI
Investment grade credit yields have not been at current levels since 2010. Despite the rising yields, public sponsors’ AROA assumptions have trended lower. In the below chart, we show that the average AROA of the largest 100 public plans against the yield of a long-duration investment grade credit index has narrowed to ~120 bps, the smallest gap over the period (the spread was ~240 bps on average over the last 25 years). We observe a similar narrative when analyzing Verus’ 10-year Capital Market Assumptions. In the low-rate environment of 2021, the cost of moving from a peer portfolio to a 100% long duration investment grade credit was 300 bps of expected return. In today’s environment, that cost has fallen to 130 bps.
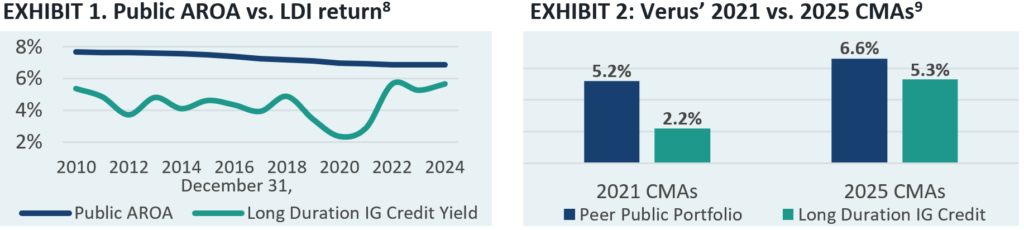
Relative to the highly uncertain outcomes of peer public portfolios that carry tremendous asset-liability mismatch, we find the ability to mitigate risk through LDI at a cost just exceeding 1% of annual return expectations to be highly attractive. We also find this opportunity cost to be cheap relative to history. When considering the current capital market environment in combination with the asymmetric risk/return pension profiles discussed earlier, plan sponsors may even be able to implement LDI solutions without increasing the expected contributions needed to support the plan.
Conclusion
Liability driven investing can offer considerable value for many pension plans. Unfortunately, prevailing reporting requirements causes the benefits of LDI to be largely unseen and thereby encourages an asset-only perspective to investing. In this TOI white paper, we discussed how public plan sponsors can better implement LDI solutions to overcome these challenges, discussed the characteristics of pension plans that make LDI beneficial, and shared our perspectives on the current environment to illustrate why LDI may appear relatively attractive today. For more information regarding our views on LDI for public plan sponsors, please reach out to your Verus consultants.
Appendix
Alternative LDI implementations
In this TOI white paper, we treat liability driven investing and cashflow matching strategies as interchangeable terms. However, cashflow matching is only a subset of a broader range of LDI strategies.
Rather than matching every cashflow of a pension plan, an LDI investor may prefer to align the duration (or key rate duration) of the liability with the LDI portfolio. This approach can be simpler than cashflow matching, which requires a custom fixed income portfolio tailored to a sponsor’s specific liability profile. Duration matching, on the other hand, can be achieved using non-custom fixed income products. Alternatively, an LDI investor may prefer duration matching over cashflow matching to align the interest rate sensitivity with fewer assets. For example, if a plan has a liability duration of 10, purchasing a fixed income portfolio with a duration of 20 can match the liability duration with half the assets required for a full cashflow match.
Pension investors can also extend beyond physical fixed income to include derivatives in their LDI portfolios. Using derivatives, investors can match interest rate sensitivity while maintaining the ability to have significant exposure to return-seeking assets.
As LDI strategies move away from cashflow matching, some of the benefits of LDI are lost. The liquidity advantages are less effective when the investment income and benefit payments do not perfectly match. Furthermore, plans can be matched on a duration basis yet hold significant interest rate exposure to non-linear shifts in yield curves.
What does an asset-only perspective miss for pension investors?
The law of one price states that two securities with identical cashflows in all markets should have the same value. Therefore, a fixed income portfolio that matches the cashflows of the liability should move in tandem with the liability. Market-based funded status measures appropriately recognize that pension investors are inherently exposed to tremendous interest rate risk, and value liabilities according to their true interest rate sensitivity.
Relying solely on AROA-based funded status measures on the other hand, ignores the liabilities interest rate risk. When this exposure is overlooked, investment decisions are largely guided by traditional portfolio management principles, where investors seek to maximize return per unit of short-term asset-only volatility. The Sharpe ratio is commonly used to measure this. Maximizing the Sharpe ratio also generally maximizes risk/reward tradeoffs on AROA-funded status basis.
The Sharpe ratio has a key shortcoming: it assumes that investors prefer the risk profile of cash to all other securities. Therefore, this is seen as the baseline by which to measure returns and risk. However, cash is not the lowest risk asset class for pension investors, rather cashflow matching fixed income is. Pension investors can therefore better measure risk/return tradeoffs with the information ratio, which measures portfolio return and risk relative to a specified benchmark (in this case the market value of the liability) instead of cash.
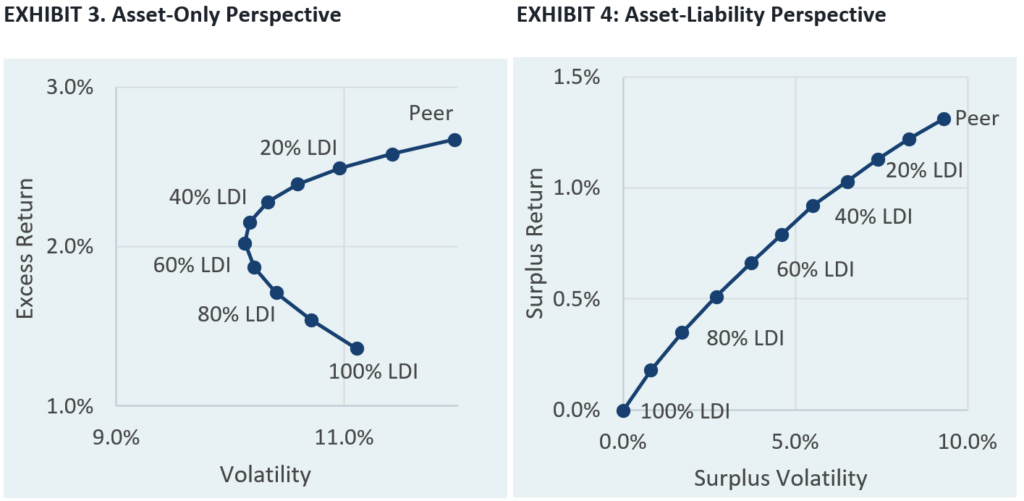
The exhibits below compare the risk and return of 11 portfolios. The highest returning portfolio is a peer public portfolio. In the subsequent portfolios we incrementally increase allocations to a cashflow matching portfolio, until the portfolio is fully allocated to LDI.
- Exhibit 3 measures risk and return in an asset-only context, as defined by the Sharpe ratio
- Exhibit 4 presents the same portfolios in an asset-liability context, using definitions of risk and return consistent with the Information Ratio
When analyzed through an asset-only lens (Exhibit 3), portfolios with more than 50% allocations to LDI appear inefficient, as risk increases while returns decrease. However, when analyzed through an asset-liability lens (Exhibit 4), any of these portfolios could be reasonable, depending on an investor’s risk preferences.
Illustrations of LDI
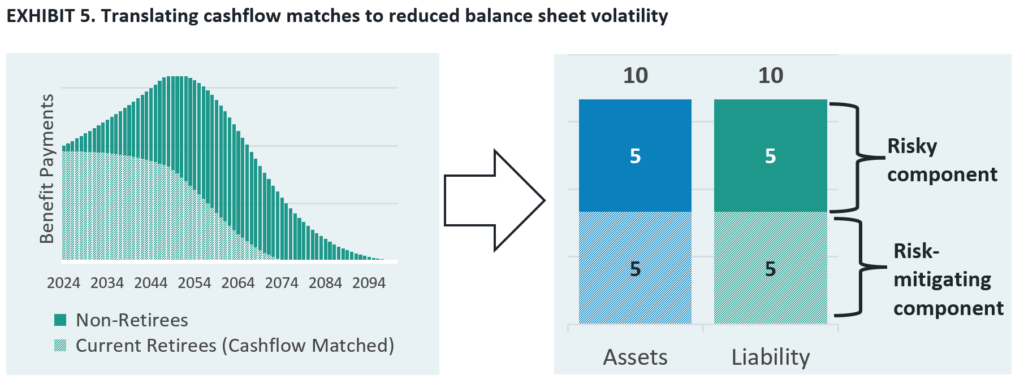
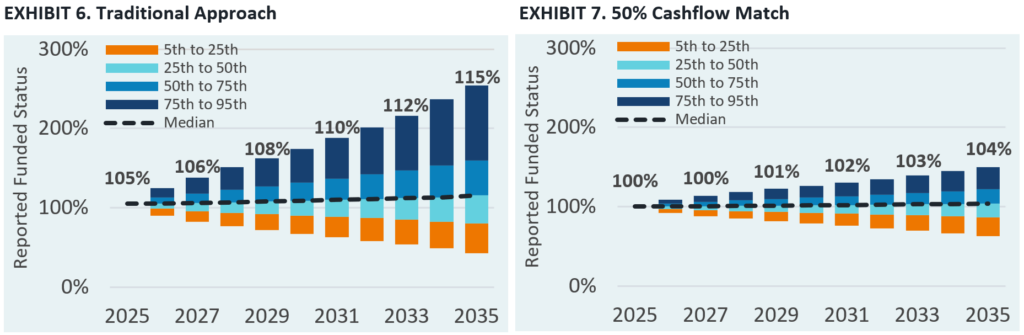
Exhibit 6 illustrates how a sample pension plan that has fully cashflow matched the benefit payments for the current retirees has reduced its balance sheet exposure (where the retirees make up 50% of the liability). The assets and liabilities for the portion of the plan that is cashflow matched moved in tandem and that portion of the plan remains 100% funded, effectively shrinking the size of the balance sheet.
Monte Carlo simulation can help us better understand how this translates to risk/reward tradeoffs. Below is a 10-year simulation of two sets of funded ratio outcomes. In Exhibit 6, we assume the plan operates like a traditional public plan. In Exhibit 7, we assume the plan implements a 50% cashflow match along with market-based reporting for that portion of the liability. This immediately reduces the funded status by 5% because the plan’s effective discount rate is also reduced10.
While an LDI strategy generally worsens expected funded ratio outcomes (bold numbers are median outcomes), we see that it reduces the range of potential outcomes and limits downside risk exposure. Under the traditional asset-only approach, the 10-year 1-in-20 worst case funded ratio outcome is 43% and improves to 63% under a 50% LDI match. Furthermore, the annual funded status volatility falls from 10.5% to 5.1%.
Drawdown risk
Investors typically measure investment performance using time-weighted returns (TWR). However, money-weighted returns (MWR), which account for the timing and size of cashflows, provide a more accurate reflection of the portfolio’s true performance. Mature pension plans with negative cashflow profiles face greater return-sequencing risk, the risk that the MWR diverges from the TWR.
This can be illustrated by two deterministic projections of a pension portfolio with a 5% negative annual cashflow position (Exhibit 5). One return stream produces a consistent 7.0% return each year, while the other experiences a 20% drawdown in year 1 followed by 10.5% annual returns in years 2-10. Although both streams report the same TWR of 7.0%, the portfolio value in the drawdown scenario is ~10% lower after ten years. The MWR drops to 6.1% in the drawdown scenario, meaning the negative cashflow profile itself resulted in 90 bps of annualized lost value.
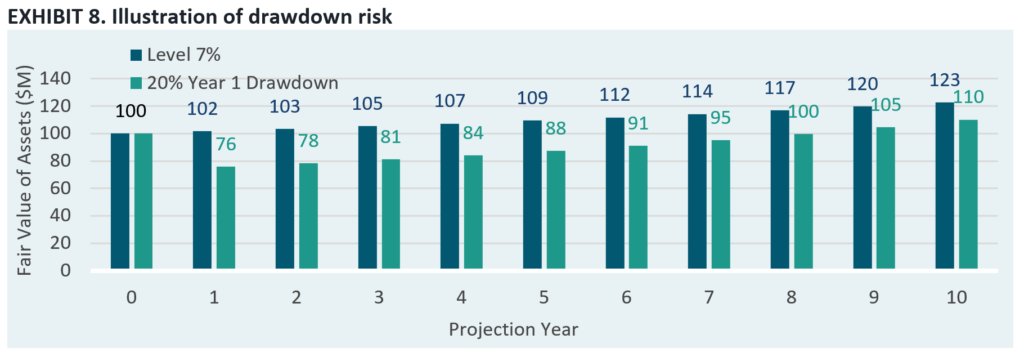
These effects result because plans with negative cashflow profiles need to sell assets during drawdowns to meet cashflow needs, which locks in market losses and limits the size of the asset base remaining for the recovery. Short-term cashflow matches help to mitigate this effect by providing income as liabilities come due, meaning risky assets do not need to be sold.
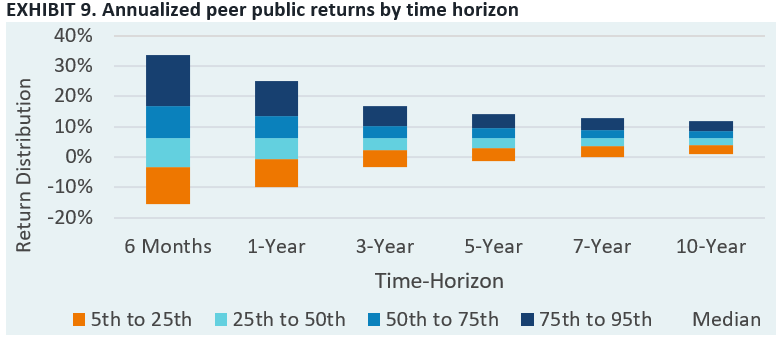
Buying a few years of liquidity can meaningfully reduce drawdown risk, as risky asset classes are more predictable over longer time horizons. The below exhibit shows that the range of annualized returns meaningfully narrows for a peer public portfolio as the time horizon extends. History tells a similar story. Since the great depression, there have been 22 instances of negative S&P 500 calendar year returns. In only 5 instances has it taken more than 3 years to recover those losses.
Notes & Disclosures
- This TOI uses cashflow matching and LDI interchangeably. Please see the appendix for further discussion.
- The better funding, greater maturity, and presence of PBGC variable rate premiums are additional drivers.
- Full funding on a market basis means there are sufficient assets to guarantee benefits through 1) a cashflow matching portfolio or 2) by transferring the obligations to an insurer.
- Please see the appendix for further discussion of the implications of the two funded status measurements.
- Please see appendix for illustrations of how LDI can reduce a plan’s risk profile.
- Please see the appendix for further discussion of drawdown risk.
- The appendix includes a Monte Carlo simulation where surplus is used to buy a cashflow matching portfolio.
- Analysis is based on Verus’ 2021 CMAs and 2025 CMAs. The 2025 CMAs are adjusted to reflect the capital market environment as of 12/31/2024. The return forecasts reflect a peer portfolio for public plans.
- Long duration IG yields are based on the Bank of America 10-15 Year US Corporate Index effective yield. Public discount rates are based on the publicplansdata.org database. The fiscal 2023 AROA is labeled as 12/31/22 in the chart. The final two years of AROAs are assumed to remain unchanged but were not part of the database.
- Monte Carlo simulation reflects peer public portfolio for non-cashflow matched assets with 6.6% forecasted return, actuarial return requirement of 6.25%, 5.33% yield to maturity of cashflow matching portfolio, no contributions, and no benefit accruals.
Past performance is no guarantee of future results. This report or presentation is provided for informational purposes only and is directed to institutional clients and eligible institutional counterparties only and should not be relied upon by retail investors. Nothing herein constitutes investment, legal, accounting or tax advice, or a recommendation to buy, sell or hold a security or pursue a particular investment vehicle or any trading strategy. The opinions and information expressed are current as of the date provided or cited only and are subject to change without notice. This information is obtained from sources deemed reliable, but there is no representation or warranty as to its accuracy, completeness or reliability. This report or presentation cannot be used by the recipient for advertising or sales promotion purposes.
The material may include estimates, outlooks, projections and other “forward-looking statements.” Such statements can be identified by the use of terminology such as “believes,” “expects,” “may,” “will,” “should,” “anticipates,” or the negative of any of the foregoing or comparable terminology, or by discussion of strategy, or assumptions such as economic conditions underlying other statements. No assurance can be given that future results described or implied by any forward looking information will be achieved. Actual events may differ significantly from those presented. Investing entails risks, including possible loss of principal. Risk controls and models do not promise any level of performance or guarantee against loss of principal.