
Download the Topic of Interest (PDF)
Download the summary deck (PDF)
Historically, investments in private assets have tended to produce higher long-term returns, on average, than investments in publicly traded assets. This outperformance is often attributed to the illiquid nature of these assets, a phenomenon commonly referred to as the illiquidity premium.
While closed-end fund structures have characteristics that may lead to better results, we believe the successful performance of private assets depends on return factors other than illiquidity alone, factors that institutional investors would be well advised to focus on.
In this Topic of Interest paper we discuss what we consider are the key drivers of successful private investment outcomes beyond the illiquidity premium. Foremost of these are skillful manager selection, best-in-class processes such as portfolio management, and effective and efficient governance.
Private equity should be thought of as an active management allocation with uncommonly high dispersion of active returns—i.e., more as an “alpha opportunity” space rather than a “beta exposure return” space. Investors often mistakenly think about private equity expected performance as a single return number. In reality, relative to public markets performance, investors will experience somewhere between deep underperformance and dramatic outperformance. What each investor’s unique portfolio will ultimately achieve depends on their experience and approach.
Private markets returns—as observed and as experienced
Historically over rolling 10-year periods, Private Equity returns, on average, have consistently outperformed Public Equity returns. This observation is reflected in the proceeding chart, which shows how the pooled IRR of all U.S. private equity funds tracked in the Refinitiv C|A universe from 1983 to 2016 performed relative to Public Market Equivalent IRRs had the same cashflows been invested in the Russell 3000 index.
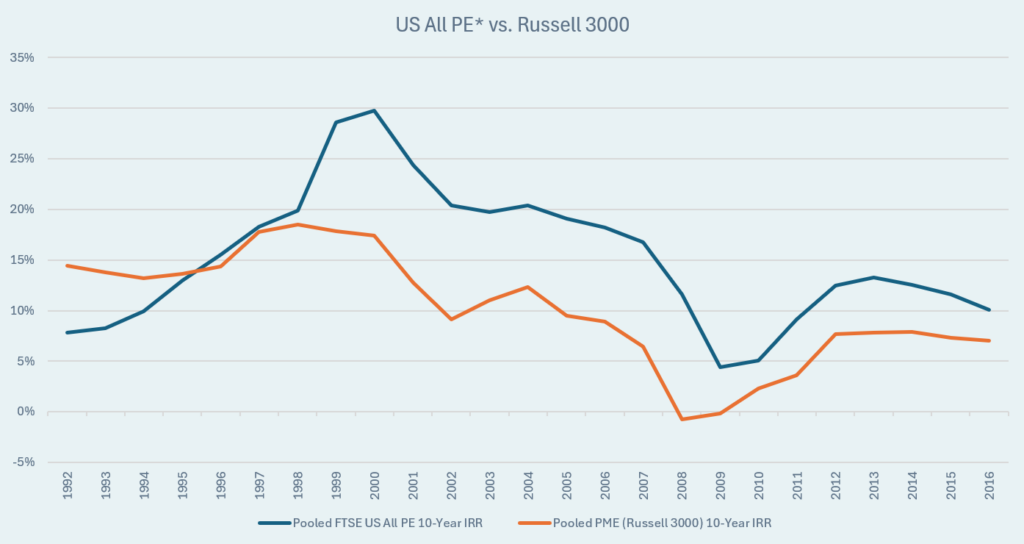
The 10-year average return of Private Equity outperformed Public Equity by 3% or more a year some 68% of the time since 1992, and 94% of time since 1999.
Noting this fairly consistent average return profile, long-term investors seeking higher returns have increasingly sought to invest in Private Equity over the last few decades. Sadly, however, their results have been mixed. Like we said, the dispersion of returns has been wide.
Based on the performance of 67 institutional portfolios tracked in the Investment Metrics database, the top- and the bottom-quartile Private Equity portfolios had a return dispersion of 5.3% per year over the 10-year period on a time-weighted basis. Bottom-quartile portfolios returned 9.7% on a time-weighted basis, compared to 8.8% by the MSCI World IMI index, an outperformance of just 0.9%, well below most institutional investors’ expected level of relative performance. In all, approximately 20% of the institutional portfolios produced returns that underperformed the MSCI World IMI index and the Russell 3000 index (see Appendix).
Key return driver: Implementation
Underlying these widely varying portfolio returns are a series of decisions made by investment staff and committees. Fund selection tends to be the core driver of outcomes, though other impactful decisions should be carefully considered. These include consistent timing of commitments and allocations, the thoughtful use of pacing studies, and when appropriate, fee negotiations, co-investments, and active participation in secondary markets.
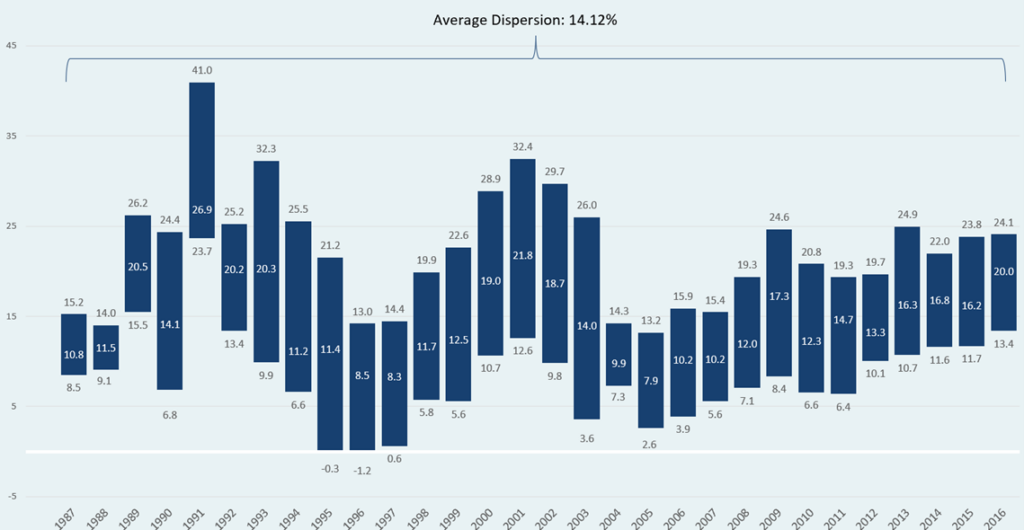
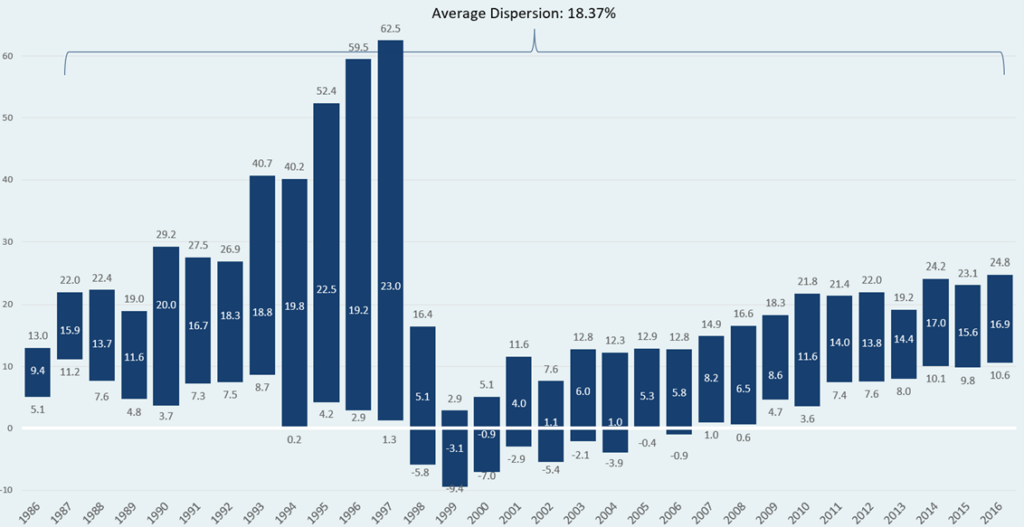
Different types of private funds exhibit different dispersions of returns, which is illustrated in the Appendix. On average from 1986 to 2016, the dispersion of returns between top- and bottom-quartile Buyout funds was a whopping 14.1% in any given vintage year; and that return dispersion was even wider at 18.4% among Venture and Growth Equity funds. Skilled investors constructing portfolios of better funds have experienced much better outcomes than their counterparts.
Further, as the dispersion of returns between vintage years can also be significant, some investors attempt to time the market by avoiding the bad years and allocating only into the good years. However, experienced investors in private funds understand that managers generally invest committed capital over a 3-7 year time period and exit those investments after a hold-time of generally 2-10 years. While we believe that privately held companies, like their publicly traded counterparts, are impacted by economic cycles broadly, it is simply impossible to predict the impact of economic cycles on vintage year commitments at the outset of a fund. Indeed, some of the worst performing calendar years regarding the macroeconomic environment have turned out to be the best vintage years to commit new capital, as private equity managers have been able to make new investments at attractive prices. The reverse has tended to also be true (allocating capital during strong macroeconomic environments results in weaker return outcomes).
For these reasons, we believe a best practice in constructing private markets portfolios is to commit to new private funds every year in a consistent manner. Disciplined investors conduct pacing studies regularly to determine the prudent level of commitments each year. These studies incorporate the anticipated flow of capital into and out of new and existing private investments, as well as future target exposures.
Depending on an investor’s size, access, and skills, private portfolio returns could potentially be enhanced in several other ways. This might include the reduction of fees directly and/or through co-investments, and more active portfolio management such as participation in the secondary markets. However, we caution that some of these initiatives come with added risks; many have the potential to tilt manager selection decisions beyond picking the best. For investors pursuing return-enhancing strategies beyond manager selection, a variety of other considerations will need to be carefully balanced to appropriately align the private markets program. These considerations might include portfolio structuring, flexible decision-making processes, governance frameworks, and staff compensation structures and incentives.
Steady hands needed
Patience can be a virtue in investing, and it is a requirement in private markets wherein strategies take years to execute, and stepping into and out of the asset class can be a recipe for failure. Thus, prior to allocating to private market assets investors should determine their maximum need for liquidity and thus set comfortable limits to support illiquid portfolios over the long haul.
Investors should also select the appropriate implementation model with a full understanding of the options available for effective implementation—including the costs between in-house or outsourced models over the entire lifecycle of investments, as these can be quite significant.
Finally, we believe trustees must appreciate the long-term nature of the asset class, the time it takes for investments to mature and produce returns, and the frequent need to learn new concepts and adjust roles and governance models as required to succeed in what might be a new universe of investments. For these and many other reasons, it is often prudent to start slow and to build more significant exposures over time.
For more information regarding our experience and expertise in building private markets programs, please reach out to your Verus consultants.
Appendix
RETURNS COMPARISON: INSTITUTIONAL PRIVATE EQUITY PORTFOLIOS VERSUS PUBLIC EQUITY
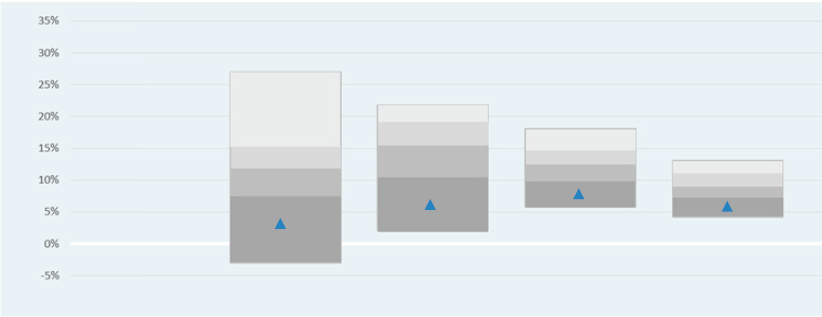
PRIVATE EQUITY PORTFOLIO RETURNS
| 3 Year | 5 Year | 10 Year | 15 Year | |
| 5th Percentile | 27.0% | 21.8% | 18.1% | 13.1% |
| Top Quartile | 21.9% | 18.8% | 15.0% | 11.0% |
| Median Quartile | 17.3% | 15.3% | 13.1% | 9.2% |
| Lower Quartile | 12.0% | 10.4% | 9.7% | 7.4% |
| 95th Percentile | -3.0% | 2.1% | 5.8% | 4.2% |
| # of Portfolios | 125 | 106 | 67 | 36 |
PRIVATE EQUITY BENCHMARK RETURNS
| Return | Rank | Return | Rank | Return | Rank | Return | Rank | |
| MSCI World Index | 4.9% | 92 | 6.1% | 89 | 8.9% | 80 | 5.4% | 86 |
| Russell 3000 Index | 7.1% | 88 | 8.8% | 82 | 12.1% | 57 | 8.7% | 60 |
*Time-weighted return is not the best measure for private investments.
BUYOUT RETURNS DISPERSION: TOP- VERSUS BOTTOM-QUARTILE FUNDS
VENTURE RETURNS DISPERSION: TOP- VERSUS BOTTOM-QUARTILE FUNDS
Disclosures
Past performance is no guarantee of future results. This report or presentation is provided for informational purposes only and is directed to institutional clients and eligible institutional counterparties only and should not be relied upon by retail investors. Nothing herein constitutes investment, legal, accounting or tax advice, or a recommendation to buy, sell or hold a security or pursue a particular investment vehicle or any trading strategy. The opinions and information expressed are current as of the date provided or cited only and are subject to change without notice. This information is obtained from sources deemed reliable, but there is no representation or warranty as to its accuracy, completeness or reliability. This report or presentation cannot be used by the recipient for advertising or sales promotion purposes.
The material may include estimates, outlooks, projections and other “forward-looking statements.” Such statements can be identified by the use of terminology such as “believes,” “expects,” “may,” “will,” “should,” “anticipates,” or the negative of any of the foregoing or comparable terminology, or by discussion of strategy, or assumptions such as economic conditions underlying other statements. No assurance can be given that future results described or implied by any forward looking information will be achieved. Actual events may differ significantly from those presented. Investing entails risks, including possible loss of principal. Risk controls and models do not promise any level of performance or guarantee against loss of principal.